The Benefits of Zümmer

Key bullet points to help you with your decision to use Zümmer.

  • Simplicity in form and function

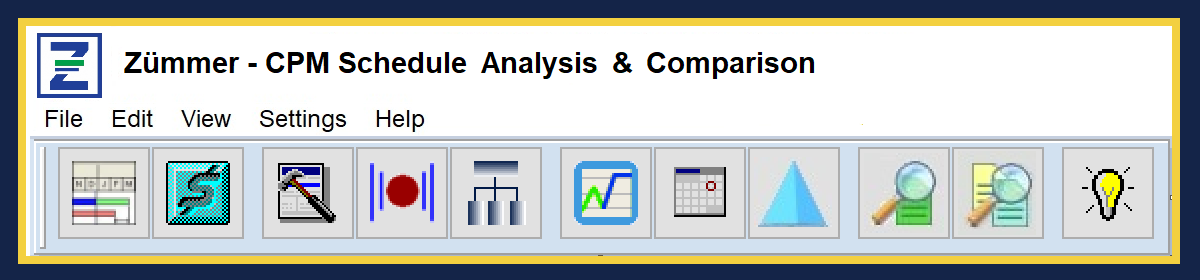
Learning to use Zümmer is easy.

There is no prerequisite for lengthy or expensive training sessions. Most users are generating Zümmer CPM Analysis & Comparison reports minutes after installation.

Simply identify the 1) “Control” Schedule and 2) the “Modified” Schedule and you’re ready to run an Analysis Series and/or a Comparison Series of reports. It’s that simple. Each Analysis/Comparison report is well defined and many are numbered to match a line item in an optional 2-Page Summary Report.

  • Streamlines and standardizes technical review time.

Running a schedule analysis or schedule comparison is easy and takes just a few minutes. The result is a series of professional grade reports, graphics and optional 2-Page summary that provides a complete profile of the CPM Schedule changes, status, quality and overall content. By performing a consistent analysis/comparison on a regular basis, you can be sure that each schedule update is of the highest quality keeping you and the project team up-to-date with the best possible and most reliable schedule information available.

  • Flexibility in Series Analysis/Comparison Report Content.

You have complete control over the number of reports generated with each Analysis or Comparison Series. There’s no need to run reams of reports just to access the specific information you need. Once a selection of reports is made, you can even run the same set of reports against other Projects. Simply, return to the Project Selection Tab, reselect the “Control” and/or “Modified” Project(s) then return to the Analysis or Comparison Tab, click Print and you’re done.

  • Helps to maintain a high-quality CPM Schedule.

If you prepare and/or update CPM schedules you want to be sure that your product meets or exceeds the guidelines established in the Contract Specifications. If you are responsible for receiving and reviewing schedule updates you want to know exactly what changed and quickly determine if the schedule changes are reasonable. With 88 Analysis Reports and 70 Comparison Reports, Zümmer has you covered no matter which side of the Project table you’re on.

  • Protects your credibility as a Professional.

Every Project Scheduler knows the feeling of the pressures associated with delivery deadlines. When it comes to schedule updates, the Scheduler is typically the last link in the update process. It is vital that the Scheduler prepare and deliver CPM schedule updates with the highest level of confidence that all activities and activity changes are checked prior to delivery. The Scheduler’s as well as the Corporate’s reputation is at stake every time a product changes hands. Why take chances? When the Scheduler complete a schedule update, an attached Zümmer schedule analysis and comparison report not only demonstrates a high-level professionalism, but also provides the reviewer with a level of confidence that the update was performed with the highest level of care and concern for accuracy.

  • Identifies cost anomalies relative to activity status.

When it comes to large schedule networks that are resource loaded, it doesn’t take long before tasks and cost get out of whack. With Zümmer’s specially designed analysis reports, cost vs. schedule anomalies are quickly identified keeping your schedules and cost data always in sync.

  • Documents “Work Orders” and “Issues”.

Nearly every construction project has its share of Work Orders (or Change Orders) and Issues. Zümmer’s Work Order and Issues Modules are design to integrate with P6’s Global Activity Code feature to produce easy-to-read and well-organized reports ready for Upper Level Management’s use and review.

  • Graphs and Reports activity status across multiple updates.

Identifying and communicating trends is a vital component for keeping a Project on-track.  Zümmer’s unique Activity History Module allows you to plot and/or tabulate the status of any activity across multiple schedule updates. With activity progress reporting capabilities, you can spot trends and provide Project Managers and Upper Level Management with the necessary tools to proactively respond and resolve milestone slippages. The Activity Progress Graph displays an easy-to-understand plot of data date vs. update date data points. The Activity History Report displays the Original and Remaining Duration, Start and Finish date, Total Float and Days to Complete for each Update of the selected Activity ID.

  • Provides clear and concise reports useful to Upper Level Management.

Most corporate executives depend on timely and valuable information in a format that’s concise and easy to understand. Every Zümmer report is neatly designed with just the right amount of information appropriate for the topic heading. Furthermore, each report layout is developed in a consistent manner allowing the reader to quickly familiarize themselves with the data format, layout and information across multiple Zümmer reports.

Copyright ©2019 FoxQuest Systems, Inc. – All Rights Reserved

Stressed vs Relaxed CPM Networks

Use the Total Float Distribution Curve to evaluate the condition of a CPM Network.

Analyzing and understanding the distribution of Total Float (TF) values in a CPM network can be a very revealing and useful indicator. In general, CPM networks with a more “Stressed” Distribution tend to be more sensitive to Project delays as compared to networks with a more “Relaxed” Distribution.

Zümmer’s Float Distribution Curve analysis report provides a graphical chart that can help you quickly determine the condition of the CPM Network. The generated graph plots the Total Float Values along the X-Axis, while the Y-Axis plots a Percentile value indicating the percentage of Tasks that have the X-Axis Float Value or less.

In the illustration below, for the “Stressed” Distribution graph, the range of Total Float Values is from 0 to about 1,210 (along the X-Axis) for the 2,243 Tasks distributed. However, at the 50% Percentile point (along the Y-Axis); the Total Float Value is about 50. In other words, about half of all the Tasks (approximately 1,121 Tasks) in this Project have a Total Float Value of 50 or less.

Similarly, in the illustration below, for the “Relaxed” Distribution graph, the range of Total Float Values is from 0 to about 870 (along the X-Axis) for the 2,725 Tasks distributed. However, at the 50% Percentile point (along the Y-Axis); the Total Float Value is about 175. In other words, about half of all the Tasks (approximately 1,362 Tasks) in this Project have a Total Float Value of 175 or less.

In comparison, and all else being equal, Projects with “Stressed” distribution are more likely to experience delays as compared to Projects with “Relaxed” distribution.

Determining a “Rule-of-Thumb” is subject to debate, however, by observation, Float Distribution Curves that are steep on the left side and flat on the right side, generally fall in the “Stressed” category. Whereas, Float Distribution Curves that are smooth from beginning to end generally fall in the “Relaxed” category.

Very Stressed distributions could be a cause for alarm since this may indicate a Project schedule that is “Claims oriented”. In these cases, you may want to consider reviewing the Project’s overall logic schema to determine where relationships can be removed or revised thereby increasing overall Total Float values.

 Very Relaxed distributions could also be a cause for alarm since this may indicate a Project schedule that is insufficiently developed. In these cases, you may want to consider reviewing the Project’s overall logic schema to determine where relationships can be added or revised thereby decreasing overall Total Float values.

Copyright ©2019 FoxQuest Systems, Inc. – All Rights Reserved

Resolving Partial Date, Duration, Float and Lag values

When it comes to CPM scheduling in the construction industry, generally, the smallest unit of time is measured in Days. In fact, many construction specifications state this categorically. However, in P6, the Duration, Total Float, Free Float, Lag values, or date that is displayed on the screen may be different from what is actually stored in the P6 database.

For example, if an Original Duration of 40 Days is assigned to an activity with a 5-Day calendar set to 8 Hours per Day, the value stored in the OD field (named Target_drtn_hr_cnt) is 320.00. In other words, P6 stores duration values in hours. (See Activity E in the illustration below).

In the illustration below, Activity ID A1020 and A1060 both have an Original Duration of 25 Days. However:

  1. A1020 was updated by assigning a Duration Percent Complete of 35%.
  2. A1060 was updated by assigning a Remaining Duration of 16 days.

P6 calculates the Remaining Duration for A1020 as 25*(1-.35) or 16.25 Days. The .25 remainder (or 2 hours) is reflected in the finish date as 09-Jun-16 10:00 (10AM). Meanwhile, A1060 displays the same Remaining Duration as A1020; however the finish date is reflected as 08-Jun-16 at 17:00 (5PM). Furthermore, A1060 is not on the Critical Path even though the Total Float value is displayed as 0 (the Duration Format Decimal value for the Day Unit of Time is set to 0).

The Partial Day effect can even cascade throughout the CPM Network affecting Total Float and Free Float values.

  1. Analysis Report #26 illustrated below displays activities with Partial Original Duration, Remaining Duration, Total Float or Free Float values. Notice that although A1040 and A1060 have non-Partial Original Duration and Remaining Duration values, their Total Float and Free Float values are indirectly affected by the Partial RD of A1020.

2. Analysis Report “Partial Original or Remaining Duration” is a subset of Report #26 with the same format and display parameters.

3. Analysis Report “In-Progress Tasks with Partial Remaining Duration” is also a subset or Report #26 with the same format and display parameters.

4. In the illustration below, Analysis Report #27 identifies activities with Partial Lags.

In all the Zümmer Analysis Reports referenced above, the duration values are formatted in Days to rounded the nearest tenth. This format can also be replicated in P6 by changing the User Preferences in the Time Units tab Duration Format Decimals settings to 1 as shown below.

In addition, in P6, the dates can be set to show time values by changing the User Preferences Dates Tab Time section to 24 hour or 12 hour as shown below.

After printing or previewing the Zümmer analysis reports, find the partial day activities and/or relationships and revise the duration values accordingly to the nearest whole day. Since Total Float values are cascading, it is suggested to start with activities sorted by Early Start.

Copyright ©2019 FoxQuest Systems, Inc. – All Rights Reserved

Trap: “Must Finish By” constraint at 00H: 00M

If in the User Preference window, the Dates-> Time option is set to “Do not show time”, then P6’s schedule calculation of Total Float values could be incorrectly calculated when a date is entered in the Project –> Schedule Date –> Must Finish By textbox.

When time is not shown and a date is entered in the Must Finish by textbox, the time stored by default is:  00H: 00M. This means that the date shown will not be considered during P6’s schedule calculations during the backward pass. This oversight causes every Total Float value to be 1 day less than the correct Total Float value.

In the illustration below, the “Analysis Charts 1 of 2” reports 4 activities with negative float even though the “Must Finish By” date matches the Contract Completion Milestone in the schedule.

Zümmer’s Analysis Charts, Analysis Statistics and Project Settings reports provide the red alert message “Possible Bad Planned End Date – Check Planned End Date Hours” under the Planned End box when the “Must Finish By” constraint date contains “00H: 00M” as the time value.

When this situation occurs, first return to the User Preferences window then change the Time option setting to either “12 Hour (1:30 PM)” or “24 Hour (13:30)”.

Second, return to the Projects-> Dates option. the “Must Finish By” option will now show with the Hours, Minutes as “00:00”.

Then change the hours and minutes setting to reflect the ending hour and minutes settings for the Project (typically 17:00/5:00 PM or 16:00/4:00 PM) as shown below.

Lastly, recalculate the Project as normal. The resulting Total Float values will now correctly include the Finish date during the backward pass process.

Copyright ©2019 FoxQuest Systems, Inc. – All Rights Reserved

Determining Added or Deleted “Driving Path” Activities

Regardless of the settings for Project->Define Critical Activities:

(a) Total Float less than or equal to; or

(b) Longest Path,

…after a schedule calculation, P6 will mark certain activities on the ‘Driving Path’. The term ‘Driving Path’ is not defined in P6, however, upon observation of the internal database table “Task”, the field name “Driving_Path_Flag” is set to “Y” for activities that are on the longest overall path as shown below.

Changes to the Driving Path between Project updates are possible, however, in P6, those changes are difficult to determine without first assigning a Project as a baseline.

In the illustration below, The Original Duration for Activity “LH930 – Paint Building Interior” was increased from 30 to 35 days causing the activity to fall on the Driving Path. Consequently, 3 activities were removed from the Driving Path.

Zümmer reports these changes in Comparison Reports #22/23 – Added/Deleted Driving Path Activities. Shown Below:

Comparison Report #22 – Added Driving Path Activities
Comparison Report #23 – Deleted Driving Path Activities

Copyright 2019 FoxQuest Systems, Inc. – All Rights Reserved

Analysis Statistics (1 of 2) – Information at your fingertips.

Zümmer’s, Analysis Statistics Report is the next level of detail from the Analysis Charts. The first of two reports neatly displays 6 key Project elements on 1 page. This matrix type report is ideal for Schedule Manager reporting. The illustration below is a sample of a typical Analysis Statistics Report.

1) Activity Status: Details the Status of every activity categorized by Activity Type.

2) Criticality: Details the Criticality State of every remaining activity categorized by Activity Type.

3) Constraints: Counts every Primary & Secondary Constraint and groups by Constraint Type.

4) Relationships: Categorizes all relationships based on Type. The R/A Factor (# of Relationships/# of Activities), measures the complexity of the CPM network, the higher the number, the more complex the CPM network. The L/A Factor (# of Lags/ # of Activities), measures the use of lags in the CPM Network. The higher the number, the more lag usage in the CPM Network.

5) Calendar: Lists all the Calendars used on the Project with individual Type, Hrs/Period, Totals and % Usage.

6) Additional Project Specifications and the Criticality Threshold values are clearly listed.

Copyright ©2019 FoxQuest Systems, Inc. – All Rights Reserved

How to end up with Negative Float without any constraints

Negative Total Float typically means that the Project is not meeting completion requirements (usually represented by a Constraint) and therefore efforts must be initiated in order to recover from the realized impacts.

However, Negative Total Float can occur even if the Project has no constraints whatsoever. In the illustration above, the Data Date is Monday, June 6 and Task C is assigned to a 7 Day Calendar with an Original Duration of 3 Days. Finish Milestone D is assigned to a 5 Day Calendar. Therefore, the Early Finish for “C” is Saturday, June 11. Since “D” is assigned to a 5 Day Calendar, it cannot end on Saturday, therefore, P6 calculates the Early Start as Monday, June 13 at 08:00 AM.

On the Backward Pass, the Late Finish for “D” and “C” are calculated as Friday, June 10 at 05:00 PM but that is 1 Day earlier than the Early Finish for “C”. Therefore the calculated Total Float for “C” is -1. The Backward Pass propagates that result back through the CPM network to “A”.

In a CPM network with many activities, and multiple calendars, it’s possible that this effect could accumulate resulting in “False Negative” Total Float values.

The solution in this illustration is to reassign “D” to the 7 Day Calendar. Then recalculate the schedule.

Copyright ©2019 FoxQuest Systems, Inc. – All Rights Reserved.